
The Great Recession was not caused by a the bursting of a housing bubble, because there was no bubble. It was caused by tight money supply.
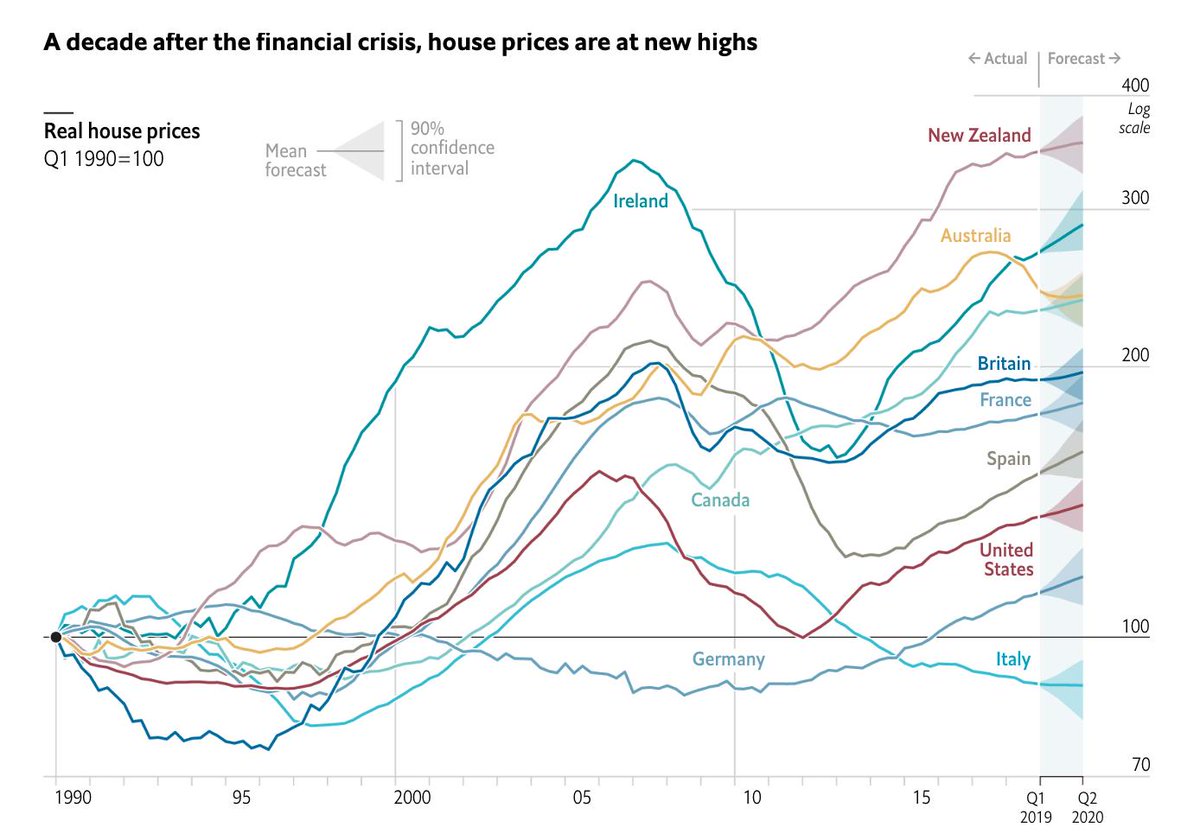
Unaffordable housing is the macroeconomic story of our time.
It is interesting that housing prices have risen so sharply in the same nations that run chronic current-account trade deficits. Some studies indicate that foreign capital inflows jack up property prices.
Kevin Erdmann contends that house prices follow house rents, so the house price explosion is really a result of property zoning and other restrictions on supply. In other words, we continue to see urbanizing job markets, especially in winning cities, but not urban housing supply.
Median Home Prices Not Affordable to Average U.S. Wage Earner in 2019
According to ATTOM Data Solutions fourth-quarter 2019 U.S. Home Affordability Report, the median home prices in the fourth quarter of 2019 were unaffordable for average wage earners in 344 of 486, or 71 percent of the U.S. counties analyzed in the report. That figure was down from 73 percent in third quarter and 75 percent from a year earlier.
The report determined affordability for average wage earners by calculating the amount of income needed to make monthly house payments — including mortgage, property taxes and insurance — on a median-priced home, assuming a 3 percent down payment and a 28 percent maximum “front-end” debt-to-income ratio. That required income was then compared to annualized average weekly wage data from the Bureau of Labor Statistics (see full methodology below).
“Home prices rose across the country by 9 percent year-over-year in the fourth quarter of 2019, and the typical home remained a financial stretch for average wage earners. However, homes were actually a bit more affordable because of declining mortgage rates combined with rising pay to overcome the continued price run-up,” said Todd Teta, chief product officer with ATTOM Data Solutions. “As long as people are earning more money and shelling out less to pay off home loans, the market should remain strong with prices continuing to rise, at least in the near term. Those are big ifs, but for now this report offers some decent findings for both home seekers and home sellers.”
The largest populated counties where a median-priced home in the fourth quarter of 2019 was not affordable for average wage earners included Los Angeles County, CA; Maricopa County (Phoenix), AZ; San Diego County, CA; Orange County, CA (outside Los Angeles) and Miami-Dade County, FL.
The 142 counties (29 percent of the 486 counties analyzed) where a median-priced home in the fourth quarter of 2019 was affordable for average wage earners included Cook County (Chicago) IL; Harris County (Houston), TX; Wayne County (Detroit), MI; Philadelphia County, PA and Cuyahoga County (Cleveland), OH.
Home price appreciation outpacing wage growth in 76 percent of markets
Home price appreciation outpaced average weekly wage growth in 369 of the 486 counties analyzed in the report (76 percent), with the largest counties including Los Angeles County, CA; Cook County (Chicago), IL; Harris County (Houston), TX; Maricopa County (Phoenix), AZ; and San Diego County, CA.
Average price of residential property (120 square meter apartments located in the most important cities) in Europe as of December 2019, per country (in euros per square meter)
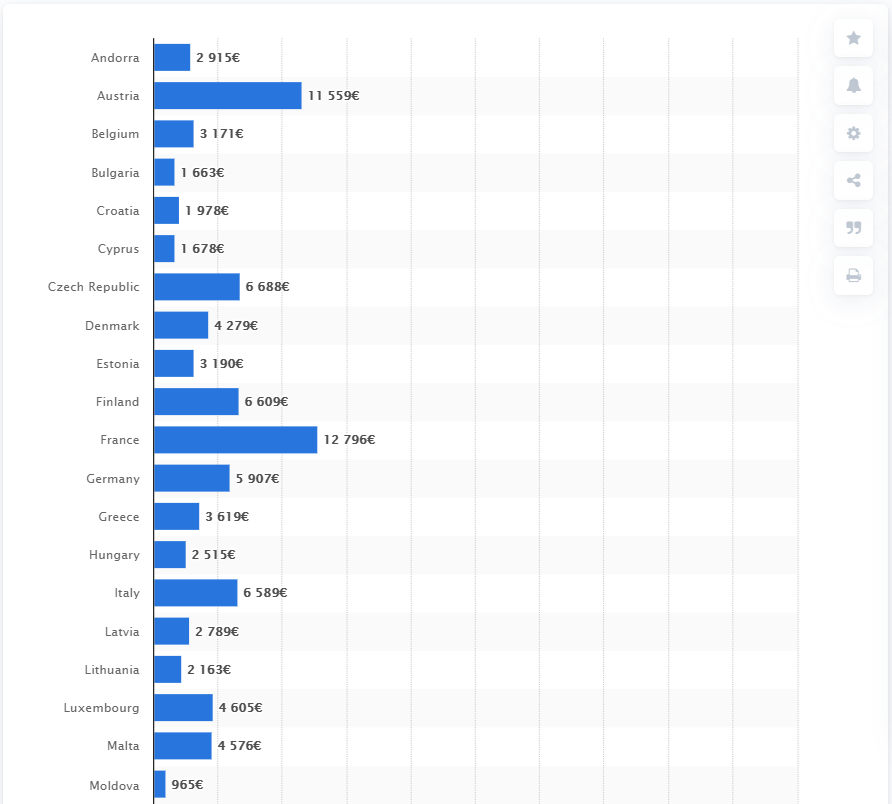
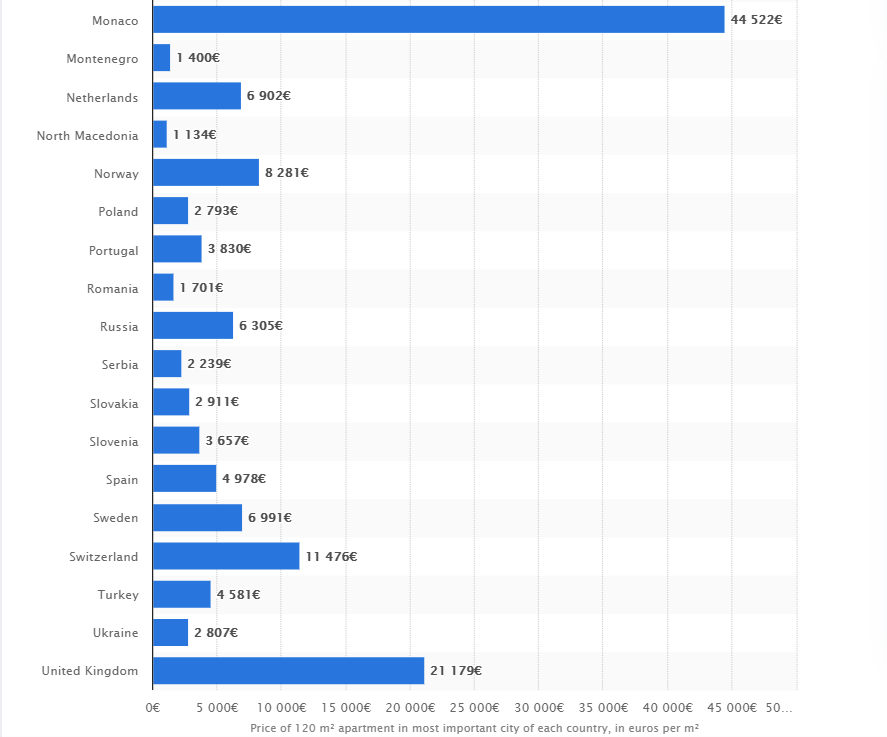
Average prices of 120 square meter apartments located in the most important cities of 38 European countries were highest in Monaco, the United Kingdom, France and Austria in 2019. These cities could either be the administrative capital, the financial capital and/or the center of the rental market. Newly-built and pre-sale property prices were not included. An apartment located in the United Kingdom’s most important city would therefore cost approximately 21,179 euros per square meter. The source does not specify the cities and states that the numbers provided in this ranking have been taken from domestic web advertisements, and not from national statistical bureaus. This is because no European level body exists that collects and tracks house prices for the EU-28 or the European continent as a whole. As of July 2018, the average price for a house in the UK was 231,163 British pounds.
Housing in Sweden the most expensive
Considering the RHPI of houses in Europe (the price index in real terms, which measures price changes of single-family properties adjusted for the impact of inflation), however, the picture changes. Sweden, Luxembourg and Belgium top this ranking with indices of roughly 164, 138 and 125 in 2018, meaning residential property is less affordable in these countries. Real values were calculated using the so-called Personal Consumption Expenditure Deflator (PCE), This PCE uses both consumer prices as well as consumer expenditures, like medical and health care expenses paid by employers. It is meant to show how expensive housing is compared to the way of living in a country.
Home ownership highest in Eastern Europe
The home ownership rate (the share of owner-occupied dwellings of all homes) was different in the European countries. In 2017, roughly half of all homes in Germany were owner-occupied whereas home ownership was at nearly 97 percent in Romania or around 90 percent in Slovakia and Lithuania. These numbers were considerably higher than in France or Italy, where homeowners made up 65 percent and 72 percent of their respective populations.