

Money supply growth fell slightly in April, falling below March’s eight-month high. Even with March’s bump in growth, though, money supply growth remains far below the unprecedented highs experienced during much of the past two years. During the thirteen months between April 2020 and April 2021, money supply growth in the United States often climbed above 35 percent, well above even the “high” levels experienced from 2009 to 2013.
As money supply growth returns to “normal,” however, this may point to recessionary pressures in the near future.
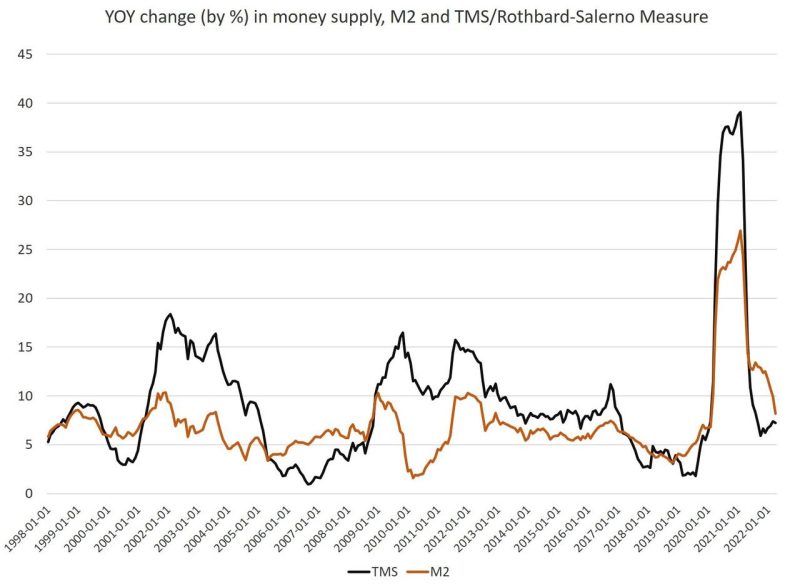
During April 2022, year-over-year (YOY) growth in the money supply was at 7.23 percent. That’s down from March’s rate of 7.41 percent, and down from the April 2021’s rate of 36.8 percent.
Historically, the growth rates during most of 2020, and through April 2021, were much higher than anything we’d seen during previous cycles, with the 1970s being the only period that comes close.
The money supply metric used here—the “true” or Rothbard-Salerno money supply measure (TMS)—is the metric developed by Murray Rothbard and Joseph Salerno, and is designed to provide a better measure of money supply fluctuations than M2. The Mises Institute now offers regular updates on this metric and its growth. This measure of the money supply differs from M2 in that it includes Treasury deposits at the Fed (and excludes short-time deposits and retail money funds).
In a contrast with TMS, M2 growth rates have continued to fall over the past five months, with the growth rate in April falling slightly to 8.20 percent. That’s down slightly from March’s growth rate of 9.92 percent. April’s rate was well down from April 2021’s rate of 18.52 percent. M2 growth peaked at a new high of 26.91 percent during February 2021.
Money supply growth can often be a helpful measure of economic activity, and an indicator of coming recessions. During periods of economic boom, money supply tends to grow quickly as commercial banks make more loans. Recessions, on the other hand, tend to be preceded by periods of slowing rates of money supply growth. However, money supply growth tends to begin growing again before the onset of recession. As recession nears, the TMS growth rate typically climbs and becomes larger than the M2 growth rate. This occurred in the early months of the 2002 and the 2009 crises. A similar pattern appeared before the 2020 recession. Money supply growth fell throughout much of 2019, and the economy appeared headed toward recession. However, the “lockdowns” and stay-at-home orders of the covid panic accelerated this process and ensured a sizable drop in economic activity. Massive stimulus then pushed money supply growth up to record levels.
Trends in money supply growth also appear to be connected to the shape of the yield curve. As Bob Murphy notes in his book Understanding Money Mechanics, a sustained decline in TMS growth often reflects spikes in short-term yields, which can fuel a flattening or inverting yield curve. Murphy writes:
when the money supply grows at a high rate, we are in a “boom” period and the yield curve is “normal,” meaning the yield on long bonds is much higher than on short bonds. But when the banking system contracts and money supply growth decelerates, then the yield curve flattens or even inverts. It is not surprising that when the banks “slam on the brakes” with money creation, the economy soon goes into recession.
In other words, a sizable drop in the TMS growth levels often precedes an inversion in the yield curve which itself points to an impending recession. Indeed, we may be seeing that right now in mid June 2022.
Fed Stimulus and Declining Loan Growth
Money supply growth was fueled in part by enormous amounts of deficit spending that occurred throughout 2020 and 2021. This led to the “need” for large amounts of monetization by the Federal Reserve. (This was needed to keep interest on the national debt low.) Indeed, as federal deficit spending grew throughout 2020, Fed purchases of government bonds increased substantially as well. Since June 2021, however, federal spending has fallen well below its earlier peaks. This has allowed the Fed to scale back its monthly asset purchases, and the Fed has announced the end of its program of large-scale purchases of US debt.
One factor that has buoyed TMS in recent months—in part driving TMS above the M2 growth rate—has been rising levels in Treasury deposits at the Fed. These totals are factored into the TMS money supply measure—but not with M2—and this total has risen from $133 billion in December to $694 billion in April.
Overall, such a sizable drop in TMS growth over the past year continues to point toward a weakening economy. With recent trends showing falling real wages, multidecade price inflation, and a flattening yield curve, we may against soon see the recessionary aftermath of a downward swing in TMS growth levels.
Source: The Mises Institute